Sreedhar Upendram and Brad Wilson
Department of Agricultural and Resource Economics, The University of Tennessee
Background
People are the most important element in a community and are often mobile. In the past century, population shifts have changed the landscape in communities across Tennessee. This study attempts to understand the underlying reasons for the spatial and temporal shifts in population across Tennessee.
The population data are analyzed across all 95 counties in Tennessee from 1900 to 2010. Some of the questions addressed include: Are people moving to urban centers? If so, where are they moving from and when did they start? Who is moving – kids, working adults or seniors? The results from this study will be useful to identify community needs, evaluate resources and formulate policy recommendations on workforce, education, healthcare, housing, and tourism among other issues that affect prosperity of residents across Tennessee.
Data and Methods
The objectives of this research are:
- To understand the population changes across communities in Tennessee
- Identify spatial and temporal trends associated with population shifts
United States Census Bureau’s decennial census served as the primary data source for this analysis. This study presents population at 10-year intervals from 1900 to 2010 for all 95 counties in Tennessee.
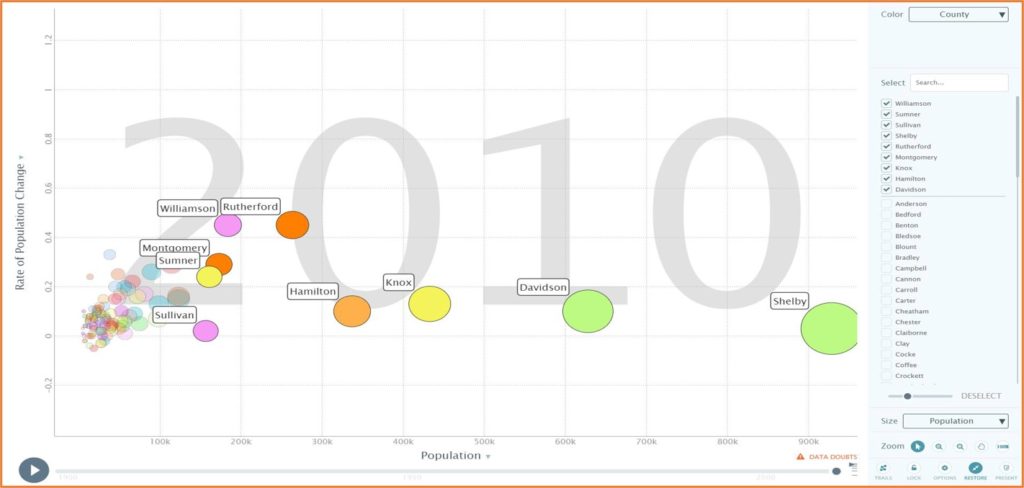
The data are analyzed to understand the spatial and temporal aspects of urban agglomeration, gender, and age groups (0 to 24, 25-64 and over 65). To visualize the population changes over time, an interactive tool tracking the rate of population change against the magnitude of population is developed (To access the poster and the tool, scan the QR code)
Results
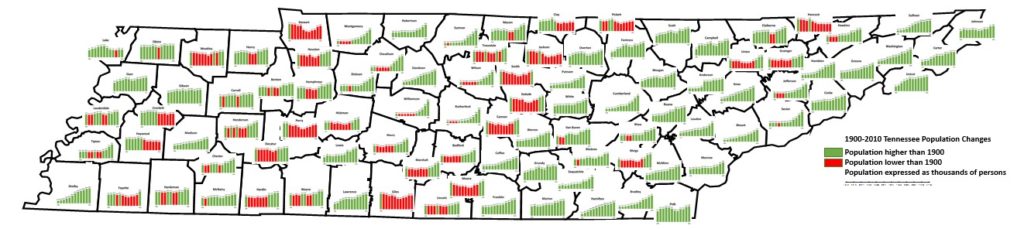
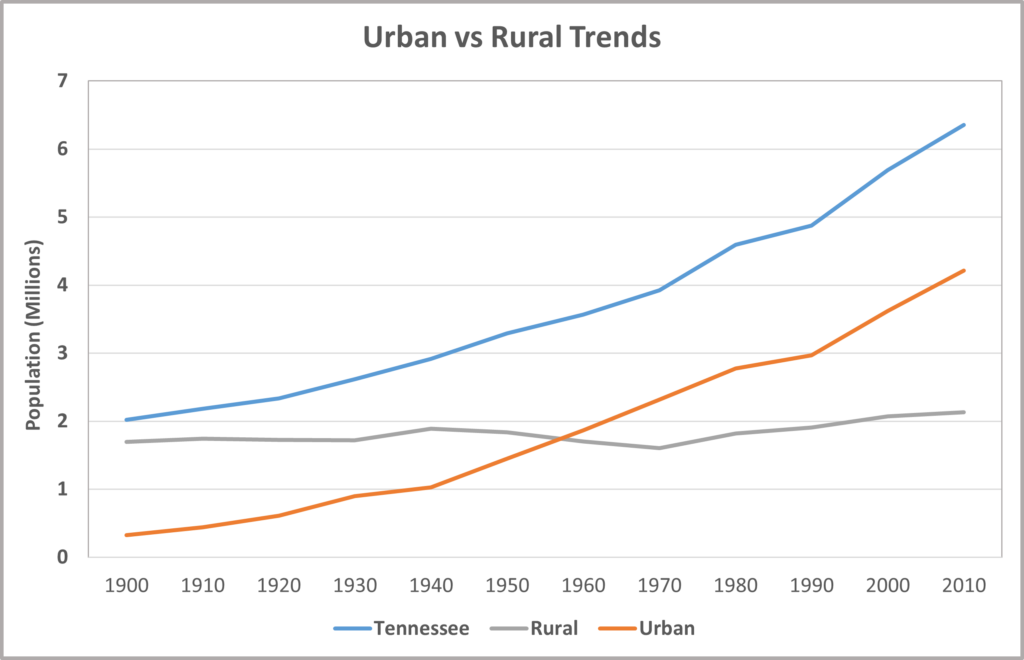
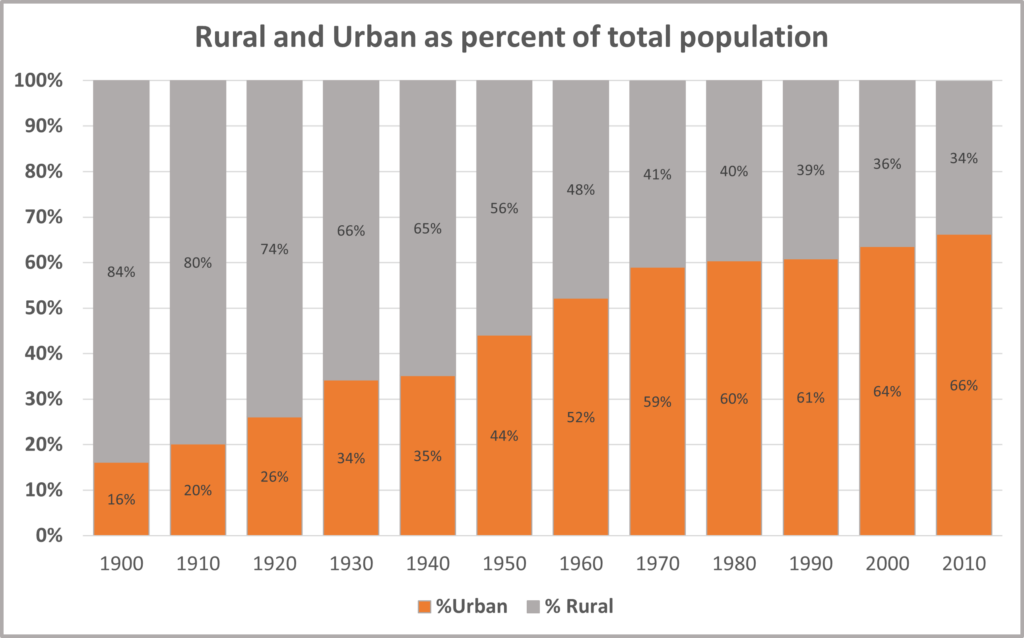
Tennessee’s population grew from 2 million in 1900 to about 6.4 million in 2010. Between 1900-2010, while the population in 86 counties across Tennessee grew, 9 counties experienced population declines. While the share of population in the rural areas declined from 84% (1900) to 34% (2010), urban areas grew from 16% (1900) to 66% (2010). Memphis, Nashville, Knoxville and Chattanooga experienced a high population influx.
Between 1900-2010, the counties with high growth were Rutherford, Williamson, Cumberland, Blount and Bradley counties. At the same time, Hancock, Haywood, Jackson, Stewart and Giles experienced the greatest population declines.
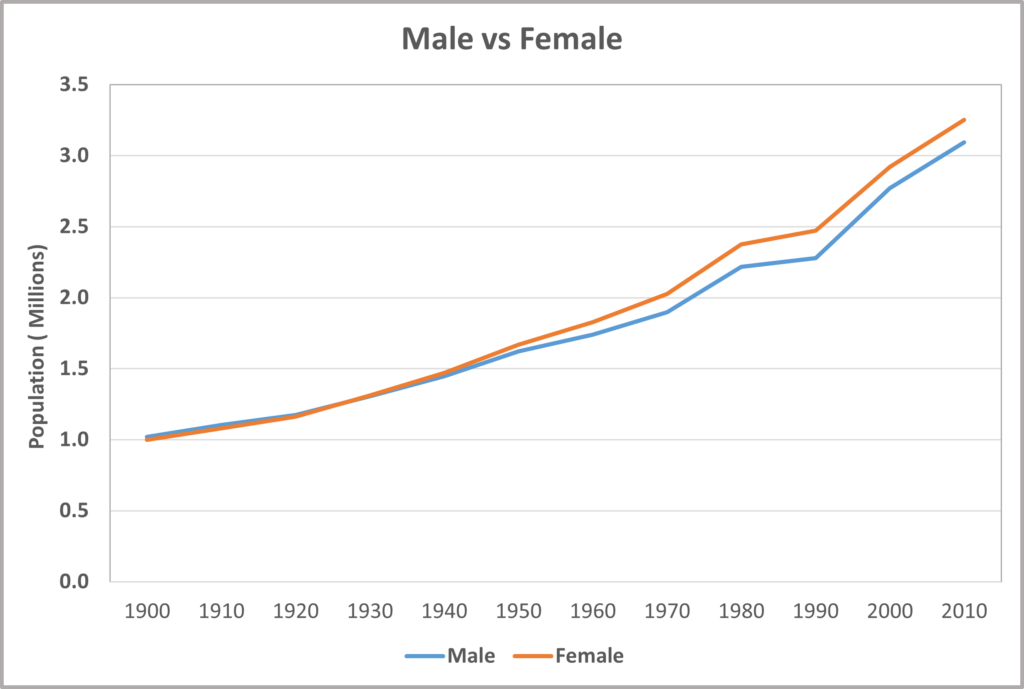
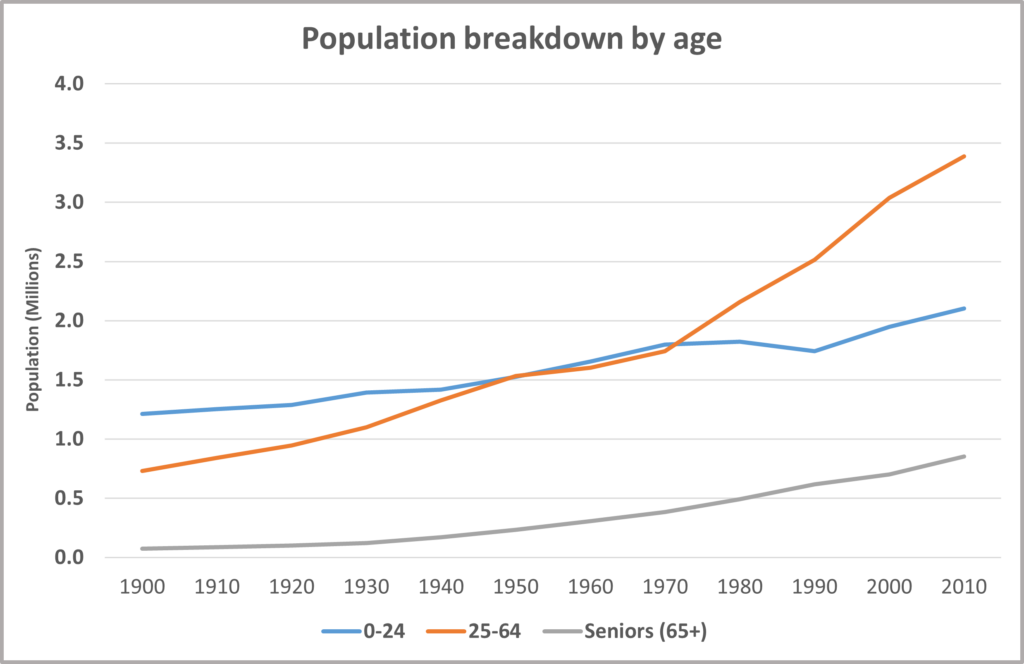
Tennessee had more males than females between 1900 and 1920, female population consistently grew and outpaced males from 1930-2010. While the proportion of 24 and under cohort was higher than working age group (25-64) or seniors (65 and over) in 1900, the working age group outpaced the dependent population by 1950 and quadrupled by 2010. The working age group accounted for 53% of the population in 2010. Among the three cohorts, although the proportion of seniors was small, they grew to 13.4% of population by 2010.
Conclusions
Over the last century, Tennessee’s population more than tripled transforming it to one of the fast-growing states in the nation. Population in rural areas shrank while urban areas grew at a faster pace. Counties along interstate highways (I-40, I-24, I-81 and I-75) and natural amenities (mountains and rivers) seemed to have experienced higher growth in population.
Although urban areas grew, population in counties around major metropolitan areas experienced a higher rate of growth. While the population in Tennessee grew the fastest between 1970 and 1980 (17%), the growth was slowest between 1980 and 1990 (6.2%). The proportion of women increased consistently over time outpacing men by 2.5% in 2010. The working age group (25-64) more than quadrupled from 1900 to 2010 supporting the dependent population (0-24 and seniors).The population shifts will serve as a basis for future analysis on workforce, education, healthcare, housing, and tourism across communities in Tennessee.
References
- Decennial census data, 1900-2010, U.S. Census Bureau Campbell, R. (2012)
- Missouri Population trends by County 1900-2010
Download a PDF of poster